Flagship Case Studies

Three projects, three professional signals.

BI and finance, development analytics, and applied research.

These executive case studies summarize the three flagship repositories without copying their full READMEs. Each card links to public evidence and labels limitations directly.

Case Studies

Executive summaries for review.

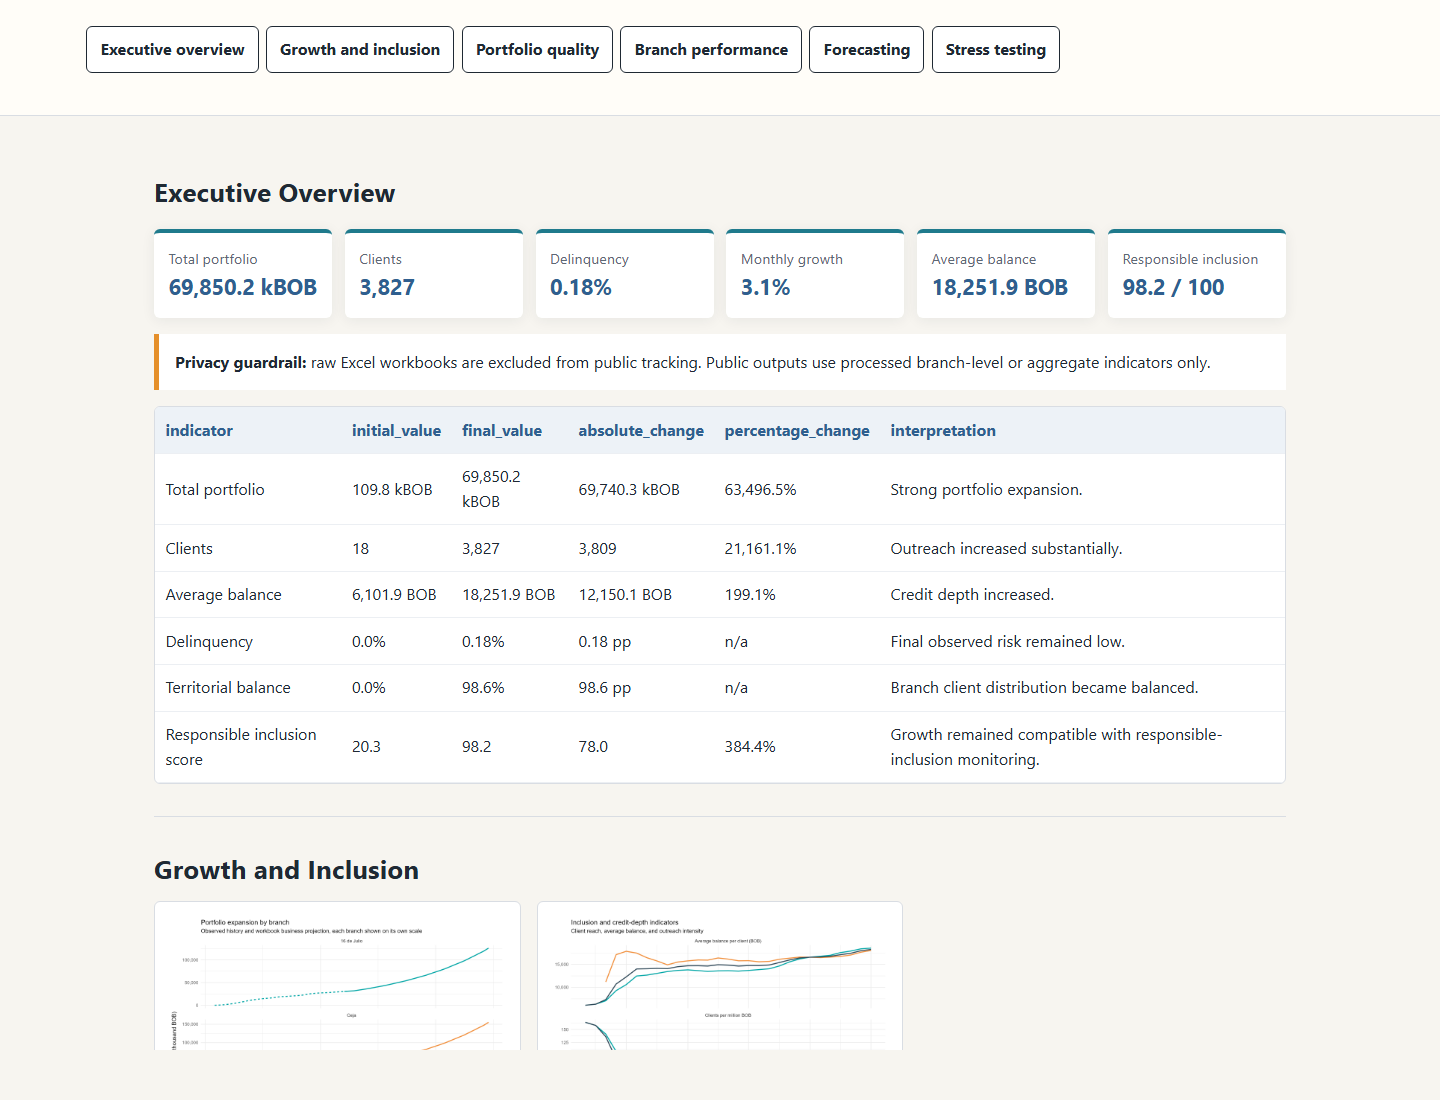
Inclusive credit risk dashboard screenshot
Case Study 1 - BI and finance

Inclusive Credit Risk Analytics Bolivia

Problem: credit and inclusion teams need a clear view of portfolio risk, stress signals and executive KPIs.

Users: BI recruiter, financial inclusion team, risk analytics reviewer.

Data: public-facing aggregate analytical outputs and privacy-reviewed documentation.

Workflow: portfolio diagnostics, KPI design, risk segmentation, forecasting/stress communication, validation and reporting.

Tools: R, Quarto, GitHub Pages, SQL-ready documentation; Power BI is planned.

Outputs: public analytical report, dashboard-style report, repository and validation/provenance documentation.

Key finding: demonstrates financial analytics and executive communication without exposing private data.

Limitation: Power BI remains planned until a public artifact, export or documented screenshots exist.
KPI designRisk analyticsBI communication
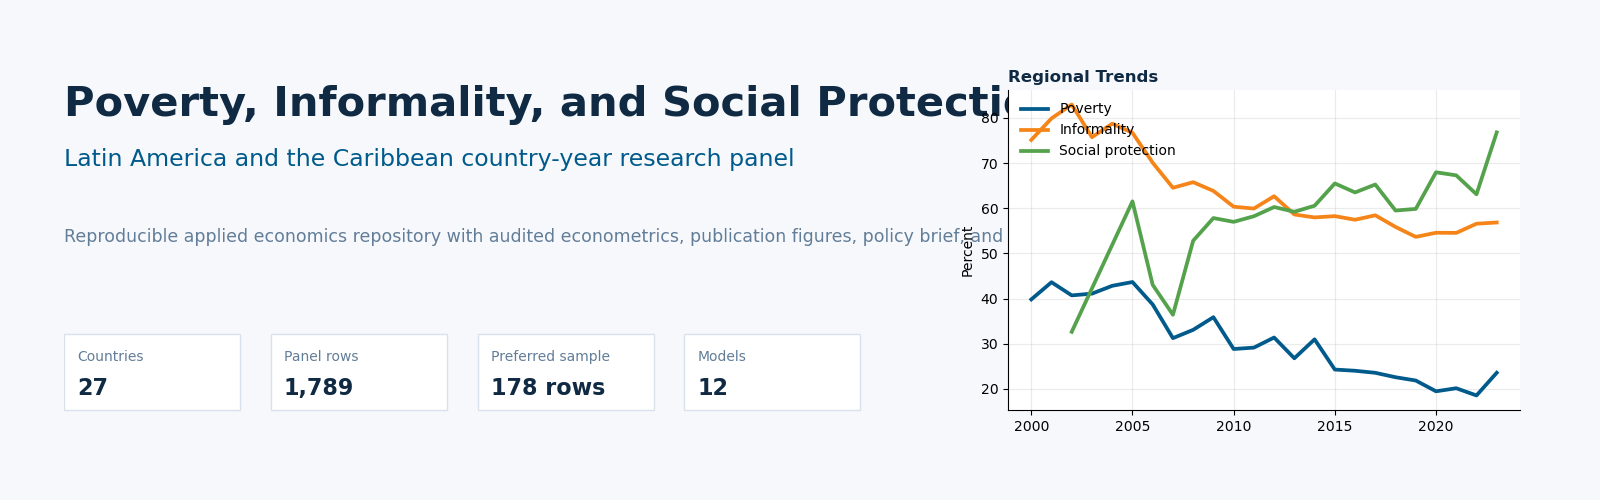
Poverty and social protection repository banner
Case Study 2 - Development analytics

Poverty, Informality and Social Protection in LAC

Problem: policy teams need comparable indicators linking poverty, labor informality and social protection coverage.

Users: development data analyst recruiter, policy team, research data analyst.

Data: public country-year analytical products, validation outputs, figures, tables and dashboard artifacts.

Workflow: multi-source integration, country-year panel construction, missingness review, validation and dashboard communication.

Tools: Python, HTML, GitHub Pages and validation reports; Tableau is planned.

Outputs: public page, dashboard, figures, tables and analytical artifact catalog.

Key finding: shows development analytics with transparent validation and policy-oriented navigation.

Limitation: Tableau storytelling remains planned until a real workbook, story, export or screenshots exist.

PythonPolicy indicatorsValidation
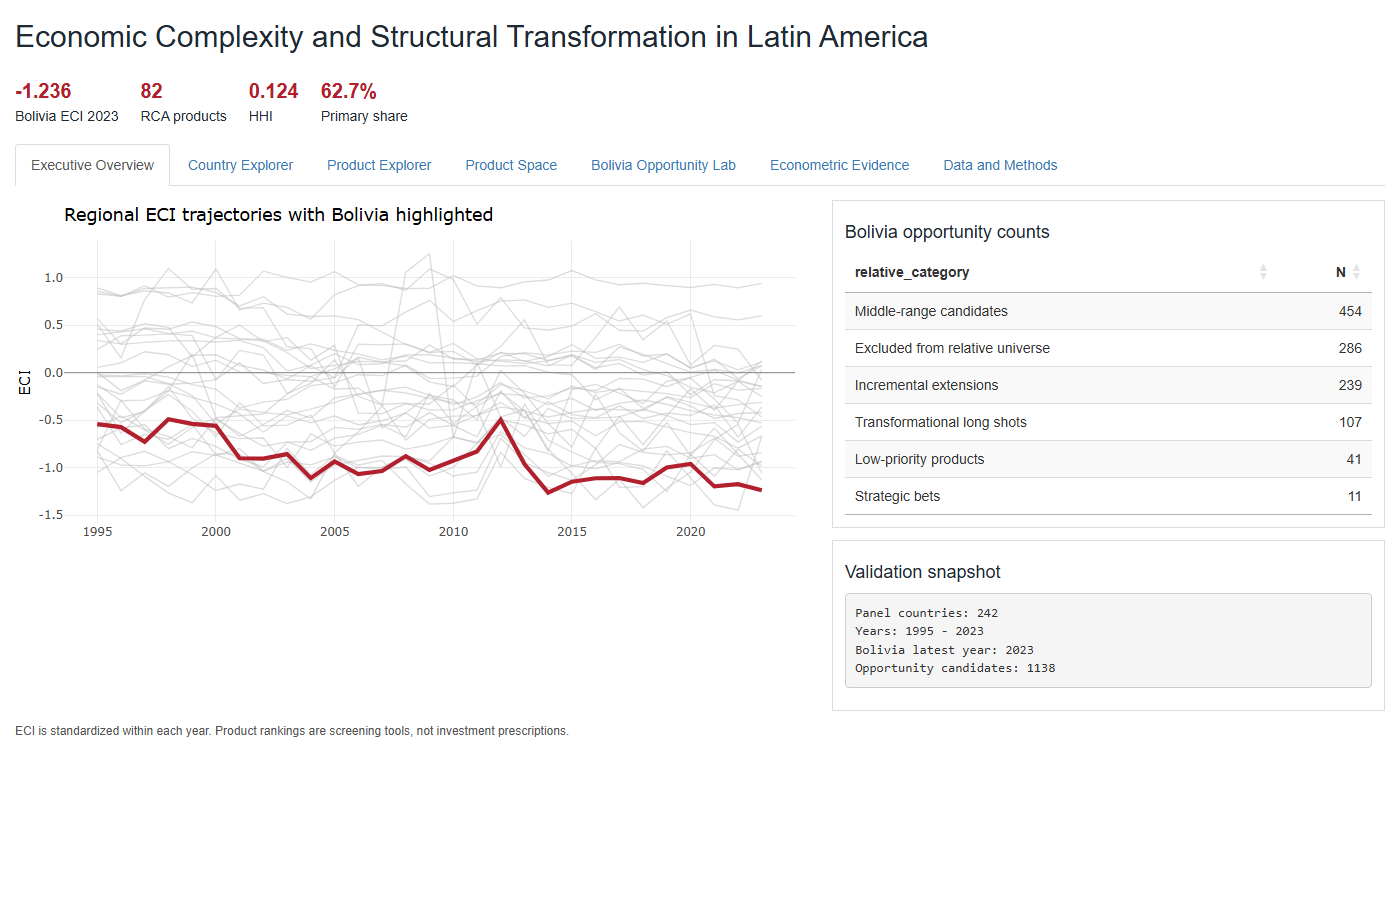
Economic complexity dashboard screenshot
Case Study 3 - Applied research

Economic Complexity and Structural Transformation in LAC

Problem: research and policy audiences need to understand productive capabilities and diversification constraints.

Users: research data analyst recruiter, development economist, international organization reviewer.

Data: public derived country-product-year outputs, Product Space diagnostics, validation files, paper, policy brief and DOI metadata.

Workflow: RCA, ECI, PCI, Product Space proximity, opportunity screening, data-quality validation and research communication.

Tools: R, Shiny, Quarto, SQL contracts and DuckDB-ready data model.

Outputs: paper, policy brief, interactive explorer, SQL contracts and Zenodo DOI.

Key finding: demonstrates advanced applied economics, network analytics and cautious policy interpretation.

Limitation: opportunity scores are screening tools; fixed-effects estimates are observational associations.

RProduct SpaceSQL contracts