Household survey analytics
Defines household and person units separately, reports denominators, builds housing and vulnerability indicators, and documents limits of interpretation.
Privacy-first household survey analytics
Privacy-first household survey analytics for understanding rural housing conditions, service access and territorial inequalities in Bolivia.
A reproducible public workflow using synthetic household and person records to demonstrate Python data processing, SQL modelling, validation, housing indicators, uncertainty reporting and policy-oriented communication without exposing respondent records.
Executive summary
This repository is a public, privacy-preserving version of a household-survey analysis workflow. It separates private research records from public communication by using fully synthetic data to demonstrate validation, uncertainty reporting, modelling and publication.
Defines household and person units separately, reports denominators, builds housing and vulnerability indicators, and documents limits of interpretation.
Uses synthetic public records, excludes original identifiable files, avoids publishing direct identifiers, and documents responsible use.
Shows Python, SQL, validation tests, analytical reporting, visual communication and reproducibility with a fixed-seed workflow.
Key metrics
All figures below are already documented in the repository outputs. They describe the synthetic public workflow and must not be interpreted as estimates for Coroico or Bolivia.
Key findings
The findings are methodological and illustrative because the public records are synthetic. No causal claims are made.
The synthetic workflow reports a weighted adequate-housing estimate of 37.9% with a 95% bootstrap interval of 26.7%-51.7%.
The housing score combines electricity, improved water, improved sanitation, wall quality, floor quality and severe-crowding status.
Income missingness is reported as 15.0%, and the missing-data audit is published as a first-class analytical output.
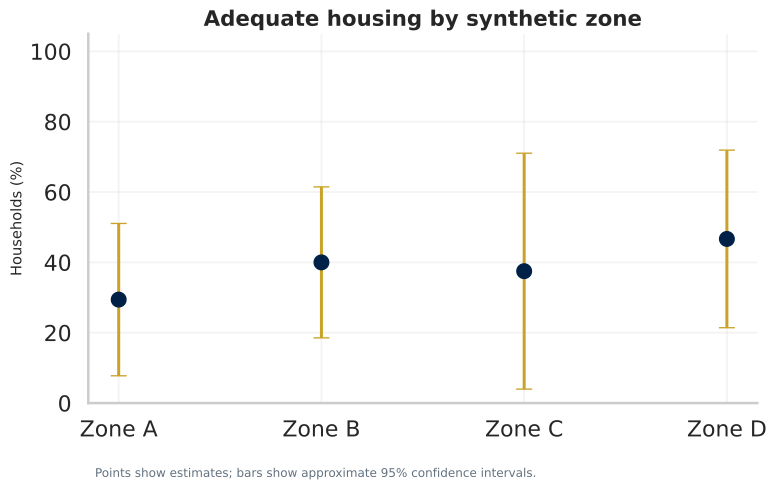
Zone-level housing outputs include intervals, making the uncertainty around small samples visible instead of encouraging unstable rankings.
The logistic model is parsimonious for a 60-household sample, and the documented model intervals cross the null.
Public outputs are synthetic, aggregate or methodological, with original identifiable records excluded from the repository.
Dashboard or report
The repository contains a public GitHub Pages report and a STROBE-aligned HTML paper. No separate dashboard was rebuilt in this phase.
Web-based publication layer presenting the synthetic workflow, headline metrics, figures, methods, privacy statement and links to reproducible assets.
Main figures
Eight non-redundant figures are reused from `docs/figures`. They summarize data quality, income, housing, service access, gender outcomes, vulnerability and the exploratory model.
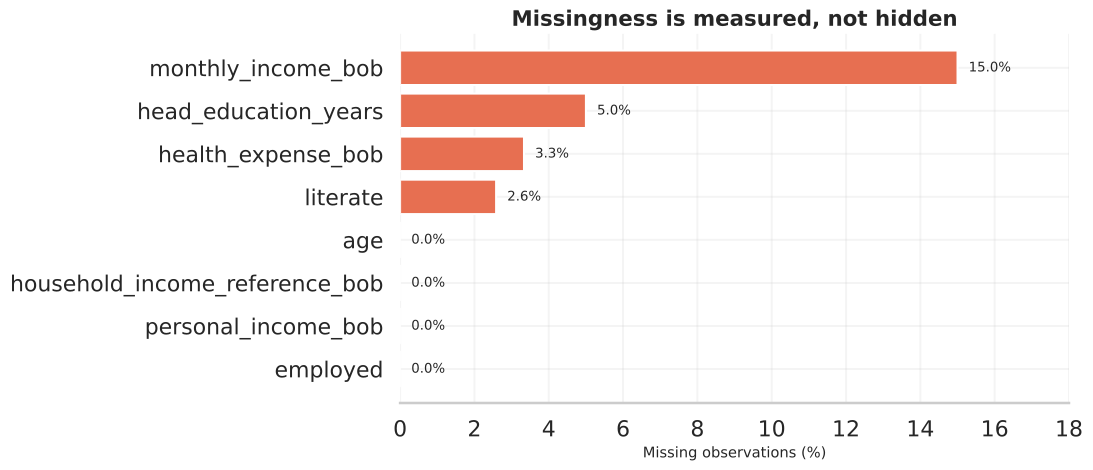
Period: synthetic cross-sectional workflow. Unit: variable-level missingness. Source: synthetic public data. Method note: missingness is disclosed before outcome modelling.
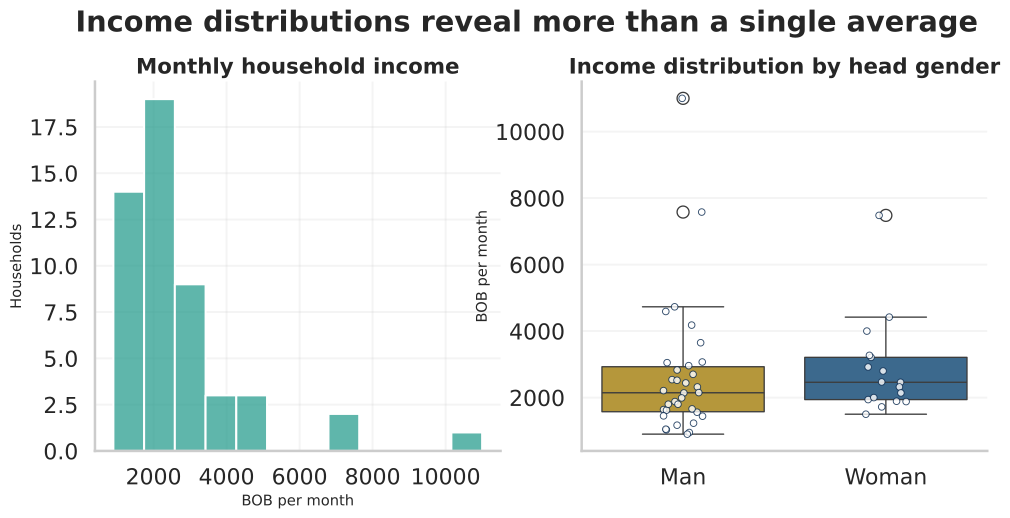
Period: synthetic cross-sectional workflow. Unit: households. Source: synthetic public data. Method note: income is summarized for descriptive context only.
Period: synthetic cross-sectional workflow. Unit: households. Source: synthetic public data. Method note: intervals are shown to avoid over-ranking small groups.
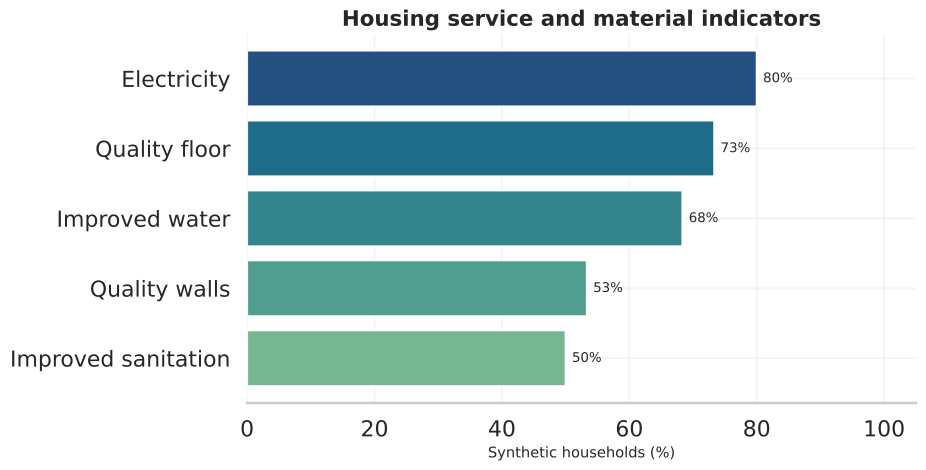
Period: synthetic cross-sectional workflow. Unit: households. Source: synthetic public data. Method note: service access enters the transparent housing measurement logic.
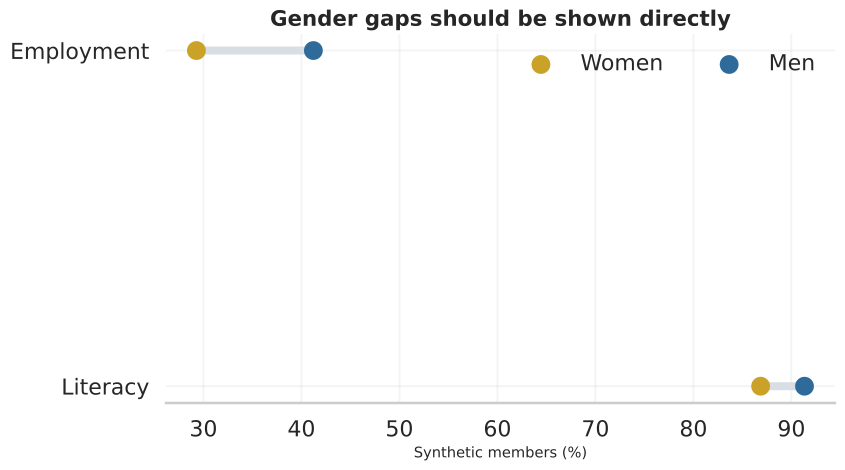
Period: synthetic cross-sectional workflow. Unit: persons and households as documented. Source: synthetic public data. Method note: differences are descriptive.
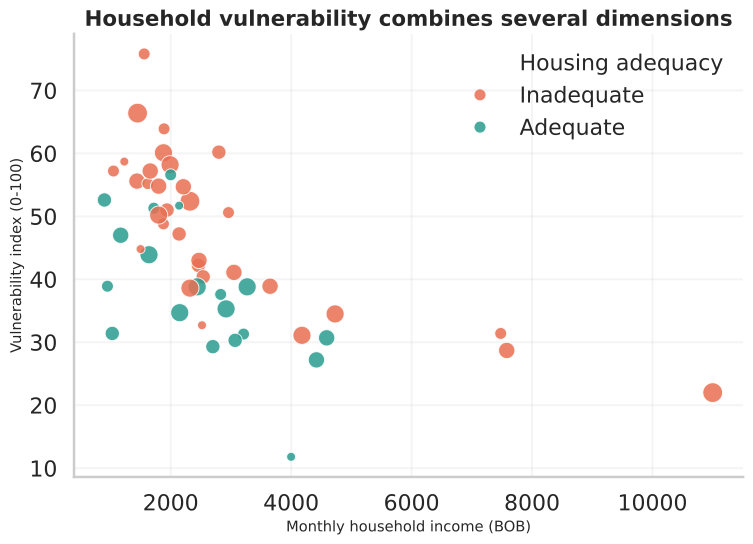
Period: synthetic cross-sectional workflow. Unit: households. Source: synthetic public data. Method note: vulnerability is analytically defined and illustrative.
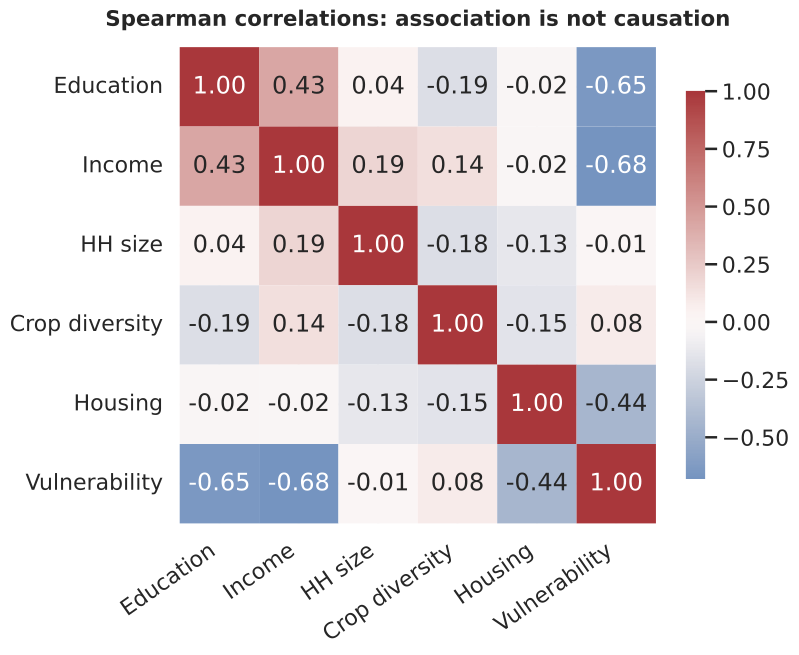
Period: synthetic cross-sectional workflow. Unit: variables. Source: synthetic public data. Method note: associations are exploratory and not causal.
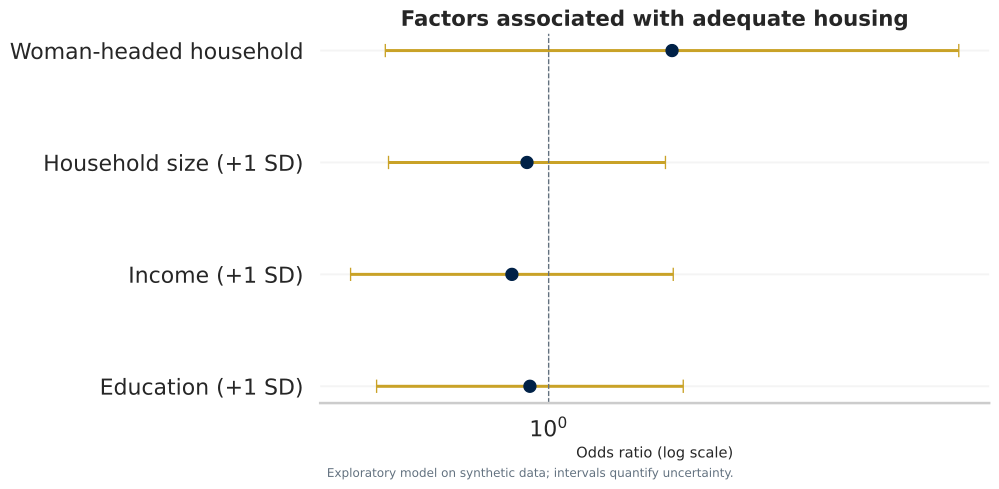
Period: synthetic cross-sectional workflow. Unit: household model. Source: synthetic public data. Method note: odds ratios summarize association, not causal effects.
Executive tables
Existing tables are linked without regeneration. Files outside `/docs` are linked through GitHub so they remain reachable when Pages is served from `/docs`.
Households, members, income, missingness, adequate housing and vulnerability summary.
Open tableOdds ratios and intervals for education, log income, household size and woman-headed household.
Open tableMachine-readable model coefficients already stored in the reports directory.
Open CSVChecklist-style table mapping reporting items to the public methodological paper.
Open checklistData sources
The public repository contains synthetic, non-identifiable records and documentation. Original identifiable records are excluded from public distribution.
Represented publicly through synthetic household and member files generated for reproducibility and privacy.
Figures, HTML report, CSV model results, source code, tests and metadata are published for review.
Original identifiable microdata are not distributed, and public outputs must not be used as population estimates.
Analytical workflow
Private source records are kept outside the public publication layer.
Data contracts reject direct identifiers and invalid ranges before analysis.
Household and member units are documented separately to protect denominators.
Service access, quality materials and severe crowding feed the housing score.
Zone comparisons include uncertainty to prevent unstable rankings.
Outputs are communicated through GitHub Pages, the HTML paper, figures and reproducible assets.
Methodology
The methods below summarize the repository's existing documentation and report outputs. Nothing was recalculated for this web update.
Housing score combines electricity, improved water, improved sanitation, quality walls, quality floor and no severe crowding.
Weighted descriptive estimates and 2,000-resample bootstrap intervals are documented in the technical report.
Missingness is audited before modelling, with income missingness reported in the public metrics.
Zone-level comparisons are used for communication, with wide intervals treated as a substantive warning.
A logistic model relates adequate housing to education, log income, household size and woman-headed household.
Synthetic records, small sample size and cross-sectional associations restrict substantive and causal interpretation.
Privacy
The repository is designed to demonstrate analytical skill while avoiding disclosure of real respondents.
The original identifiable household records are not distributed publicly.
Published files are synthetic, aggregate, methodological or code assets.
The test suite checks that public generated columns avoid forbidden direct identifiers.
Public outputs are not valid estimates for Coroico, Bolivia or any real population.
Validation, fixed-seed generation and responsible-use documentation are part of the repository.
A real survey release would require sampling design, field documentation and authorization before substantive publication.
Reports
HTML paper with abstract, methods, results, figures, two embedded tables, limitations and declarations.
Open paperShort decision-oriented summary of the synthetic workflow, headline metrics and limitations.
Open summaryQuarto source documenting the research design, estimands, measurement, missingness, descriptive outputs and model specification.
Open sourceReproducibility
The repository documents commands and contains Python source, tests, SQL and outputs. This web update did not run pipelines or regenerate results.
Source files generate synthetic records, validate data contracts, produce metrics, fit the exploratory model and publish outputs.
The SQL file builds a portable household-member analytical view with quality flags and synthetic-approved data only.
Open SQLThe test suite checks reproducible generation, public-data contracts and finite model outputs.
Open testsLimitations
Citation
Citation metadata are available in the repository's CITATION.cff file. The citation warning states that synthetic results should not be cited as empirical evidence.
Open CITATION.cffAuthor and navigation
Development data analyst portfolio spanning poverty, housing, credit risk, financial development, economic complexity and structural vulnerability.