- Labor informality, unemployment and inequality are positively associated with structural vulnerability in existing panel outputs.
- Social protection coverage and GDP per capita are negatively associated with structural vulnerability.
- Fixed-effects and two-way fixed-effects specifications are preferred for interpretation.
- The evidence is descriptive and associational, not causal.
- Mechanism outputs suggest social assistance and social insurance expansions are correlated across the region.
- Country event-study outputs are exploratory and should be interpreted cautiously.
Development analytics and structural vulnerability
Structural Vulnerability in Latin America and the Caribbean
Reproducible development analytics for comparing structural vulnerability, institutional constraints and socioeconomic risks across Latin America and the Caribbean.
Country-year panel evidence on poverty, labor informality, social protection, macroeconomic conditions and structural vulnerability. Evidence is descriptive and associational, not causal.
Executive Snapshot
Verified coverage and analytical scope.
648country-year observations
27countries
2000-2023panel years
178complete-case econometric observations
17countries in model sample
6index components documented
2normalization variants
Boliviaprofile included in dashboard figures
Key Findings
Documented findings and interpretation boundaries.
Dashboard
Existing public research dashboard.
Dashboard products
The dashboard presents rankings, Bolivia profile, regional trends, correlation diagnostics, scatter plots, model coefficients, missingness and the research pipeline.
Main Figures
Existing figures reused without regeneration.
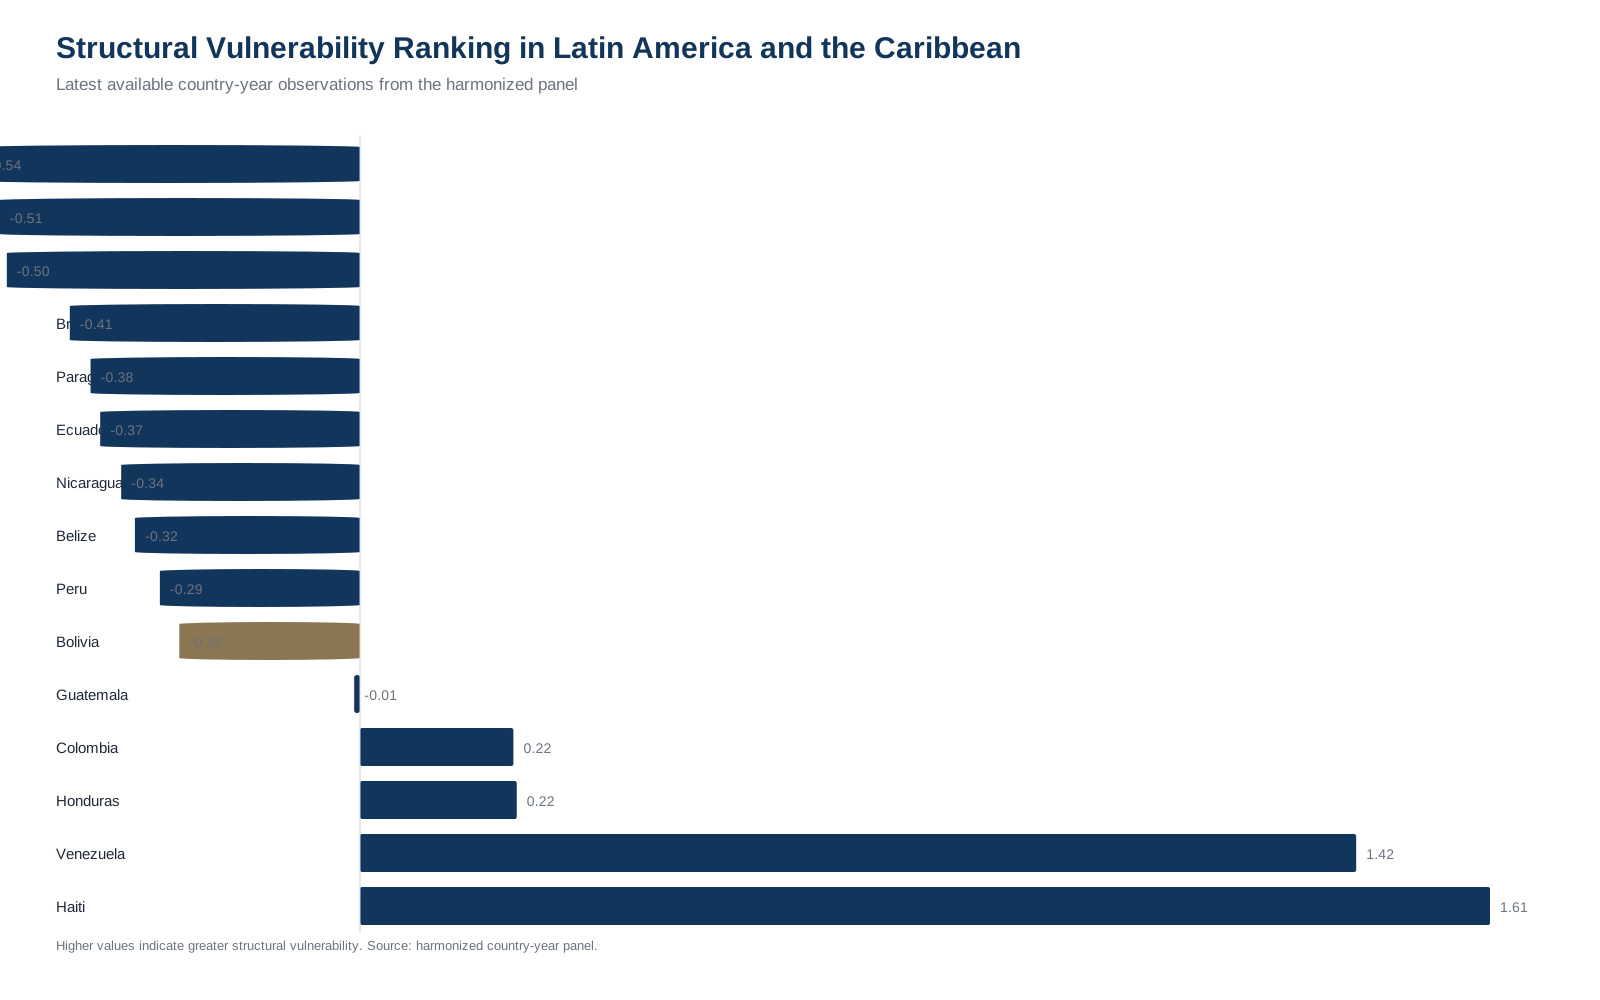
Structural vulnerability ranking
Compares overall vulnerability across countries.
Period: 2000-2023 panel. Unit: index/ranking. Source: harmonized country-year panel and dashboard outputs. Note: rankings are sensitive to normalization, weighting and coverage.
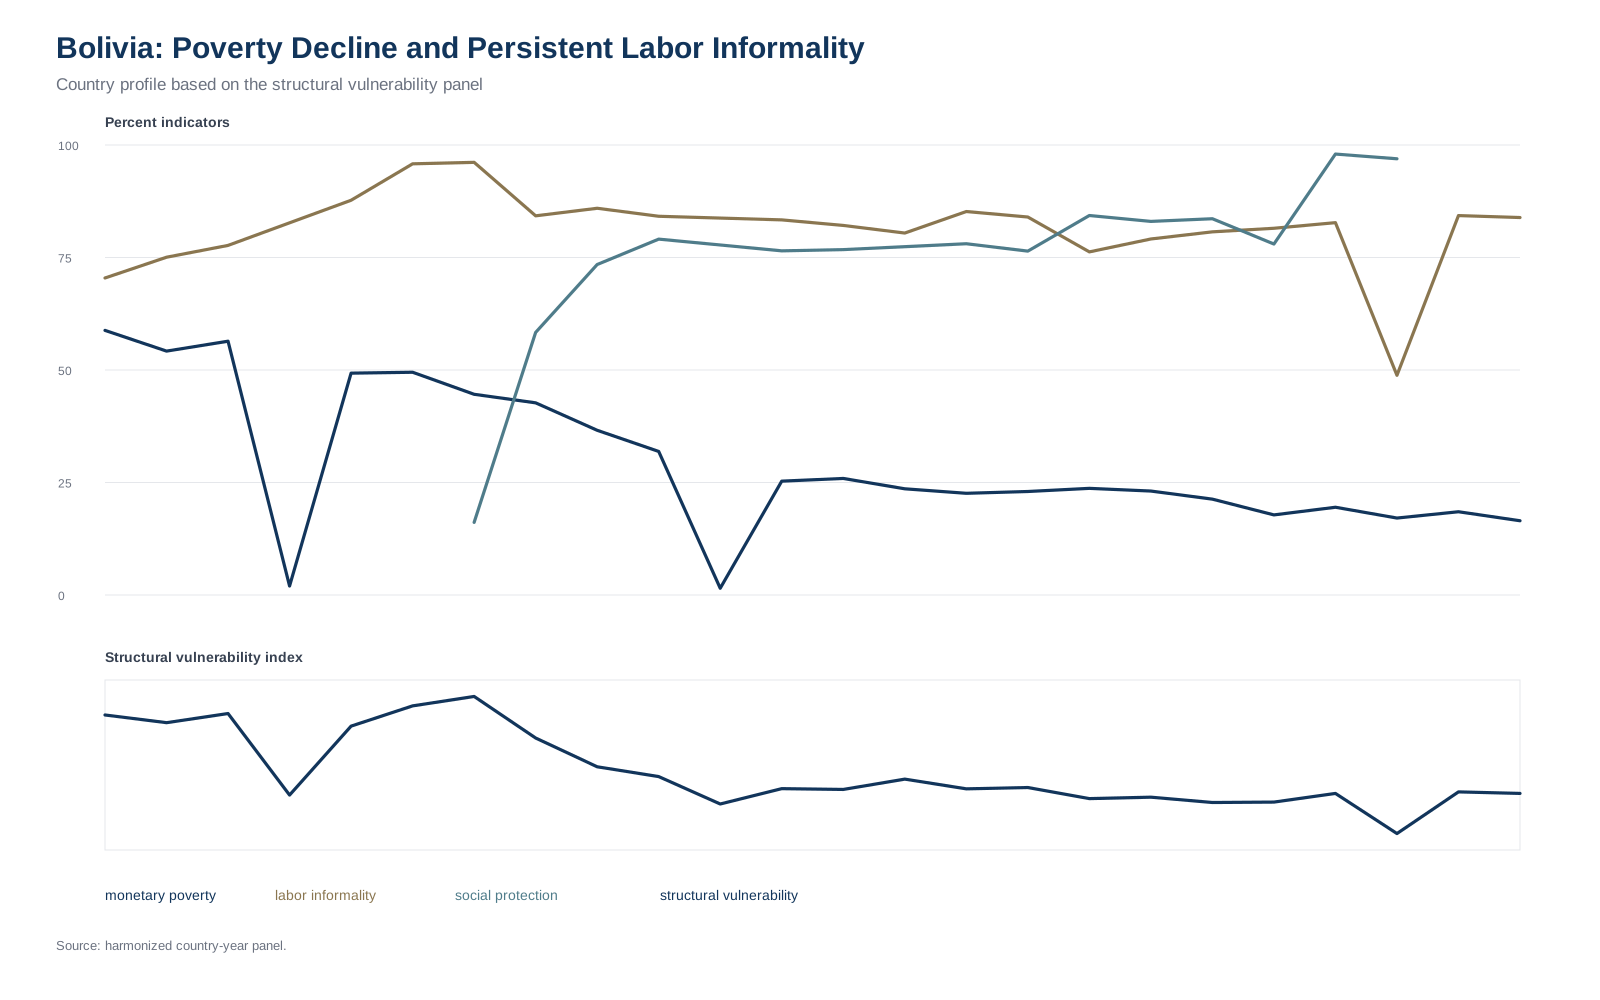
Bolivia profile
Summarizes Bolivia relative vulnerability profile.
Period: 2000-2023 panel. Unit: country profile indicators. Source: harmonized country-year panel and dashboard outputs. Note: profile is descriptive, not causal.
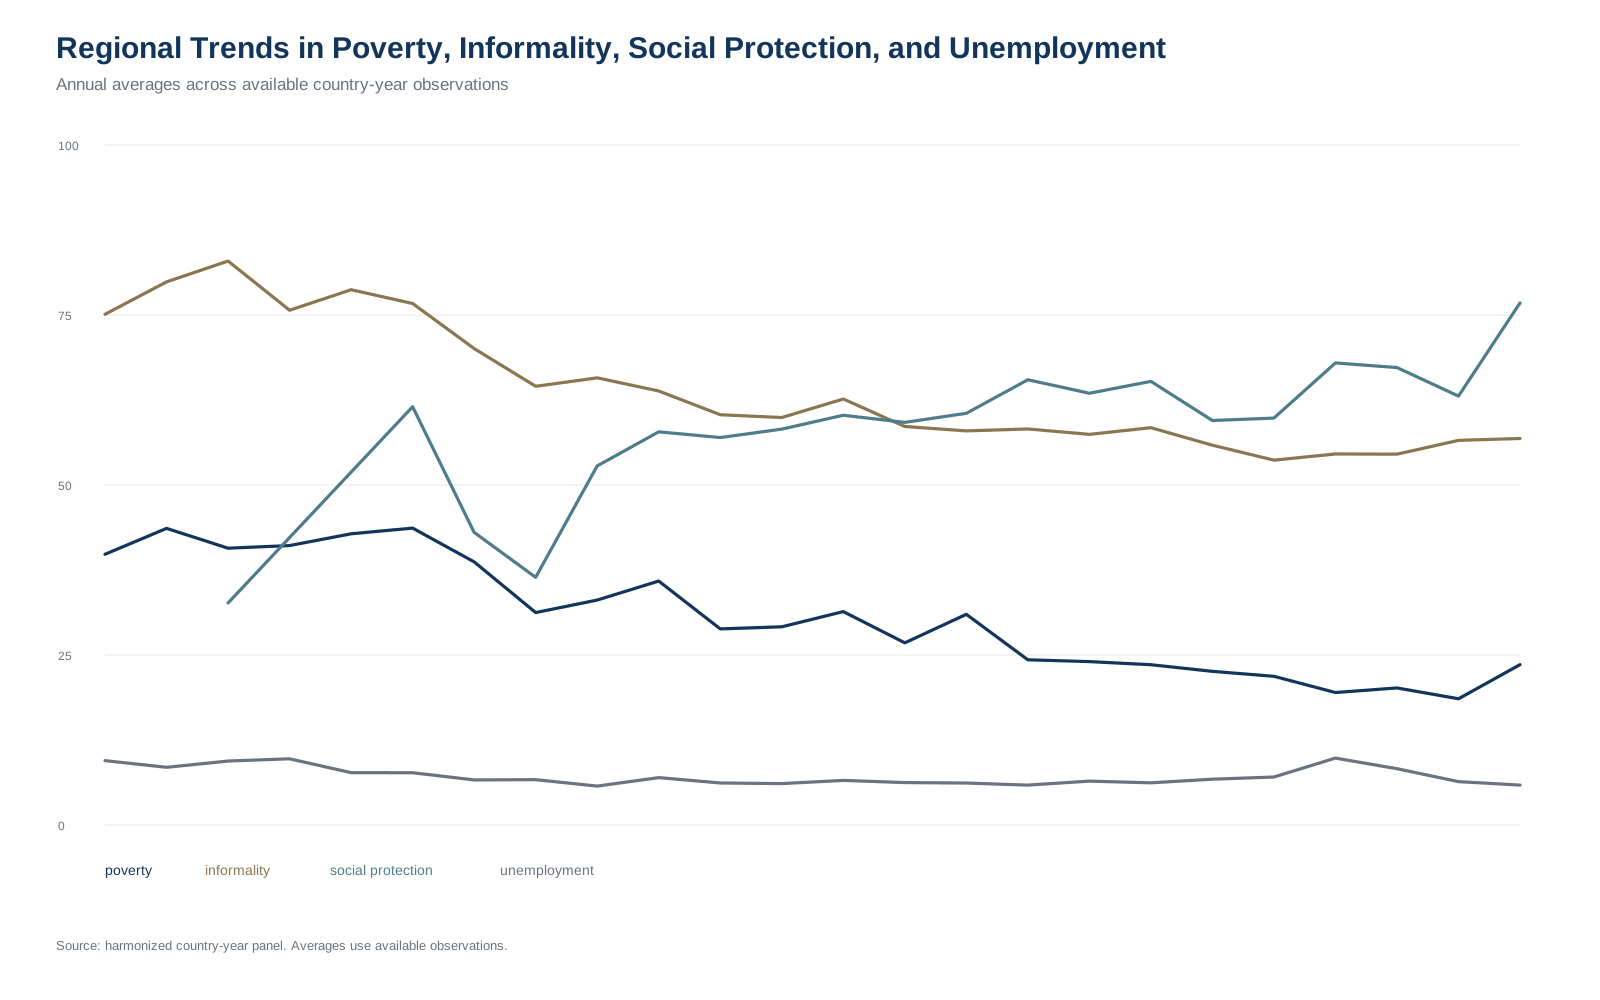
Regional trends
Tracks regional movement in vulnerability-related indicators.
Period: 2000-2023 panel. Unit: regional averages. Source: harmonized country-year panel and dashboard outputs. Note: averages mask country heterogeneity.
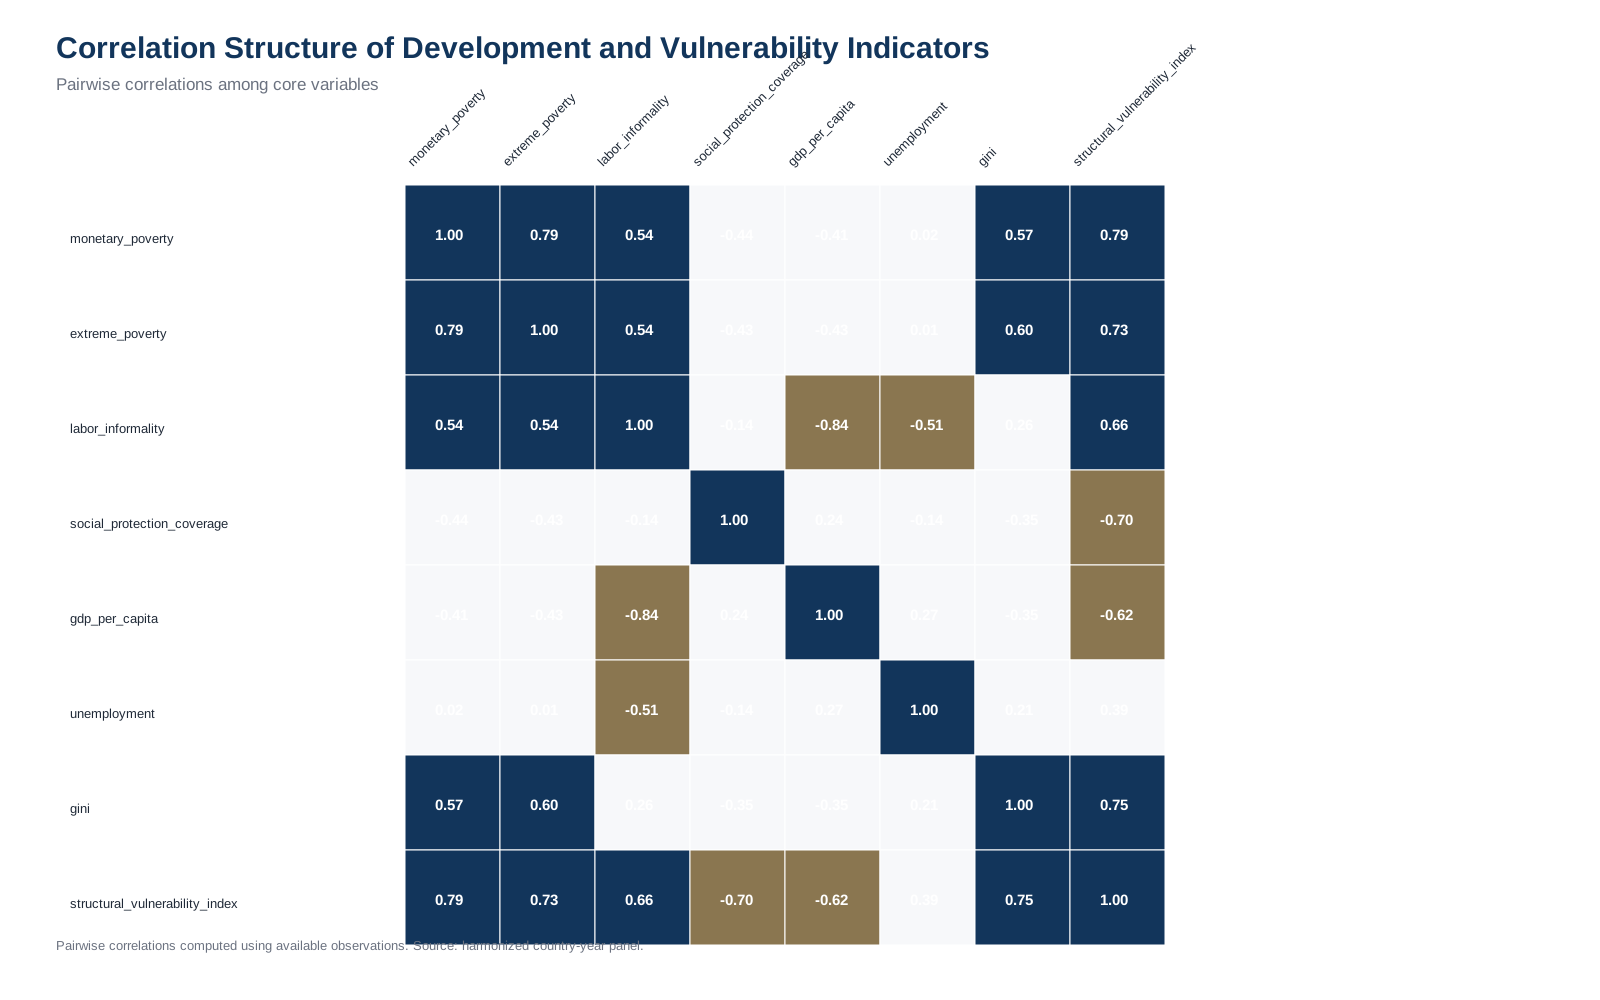
Indicator heatmap
Shows relationships among vulnerability, poverty, informality and protection variables.
Period: 2000-2023 panel. Unit: correlations. Source: harmonized country-year panel and dashboard outputs. Note: correlations are not causal estimates.
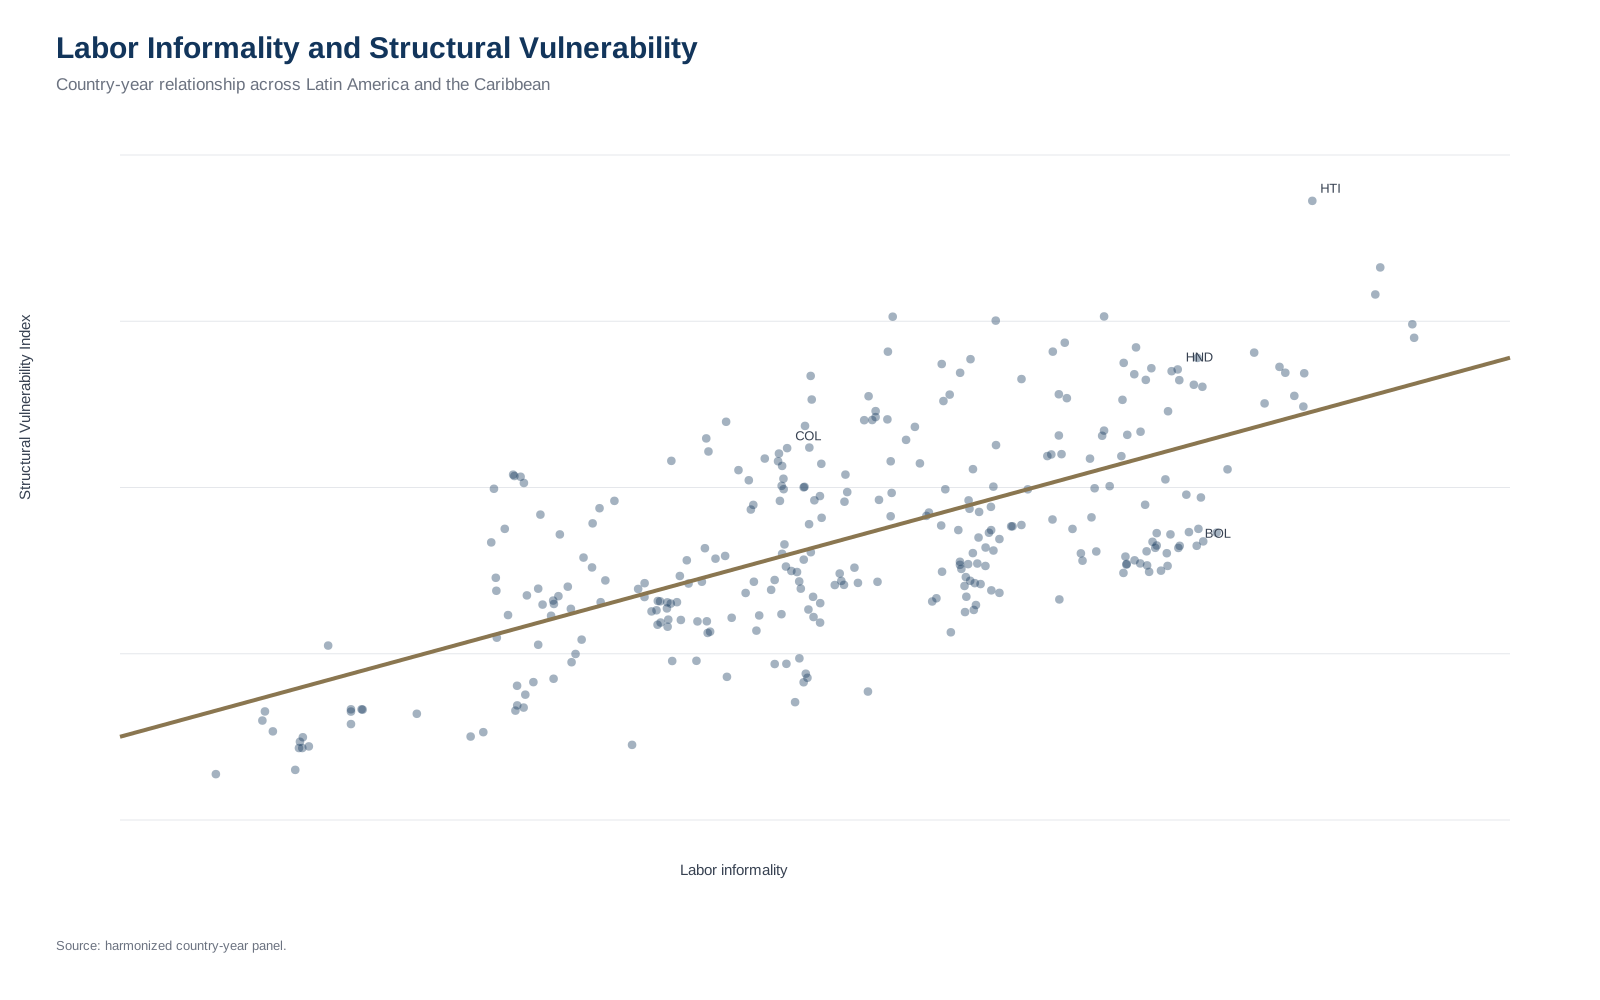
Informality and vulnerability
Visualizes the association between labor informality and structural vulnerability.
Period: 2000-2023 panel. Unit: country-year indicators. Source: harmonized country-year panel and dashboard outputs. Note: descriptive association only.
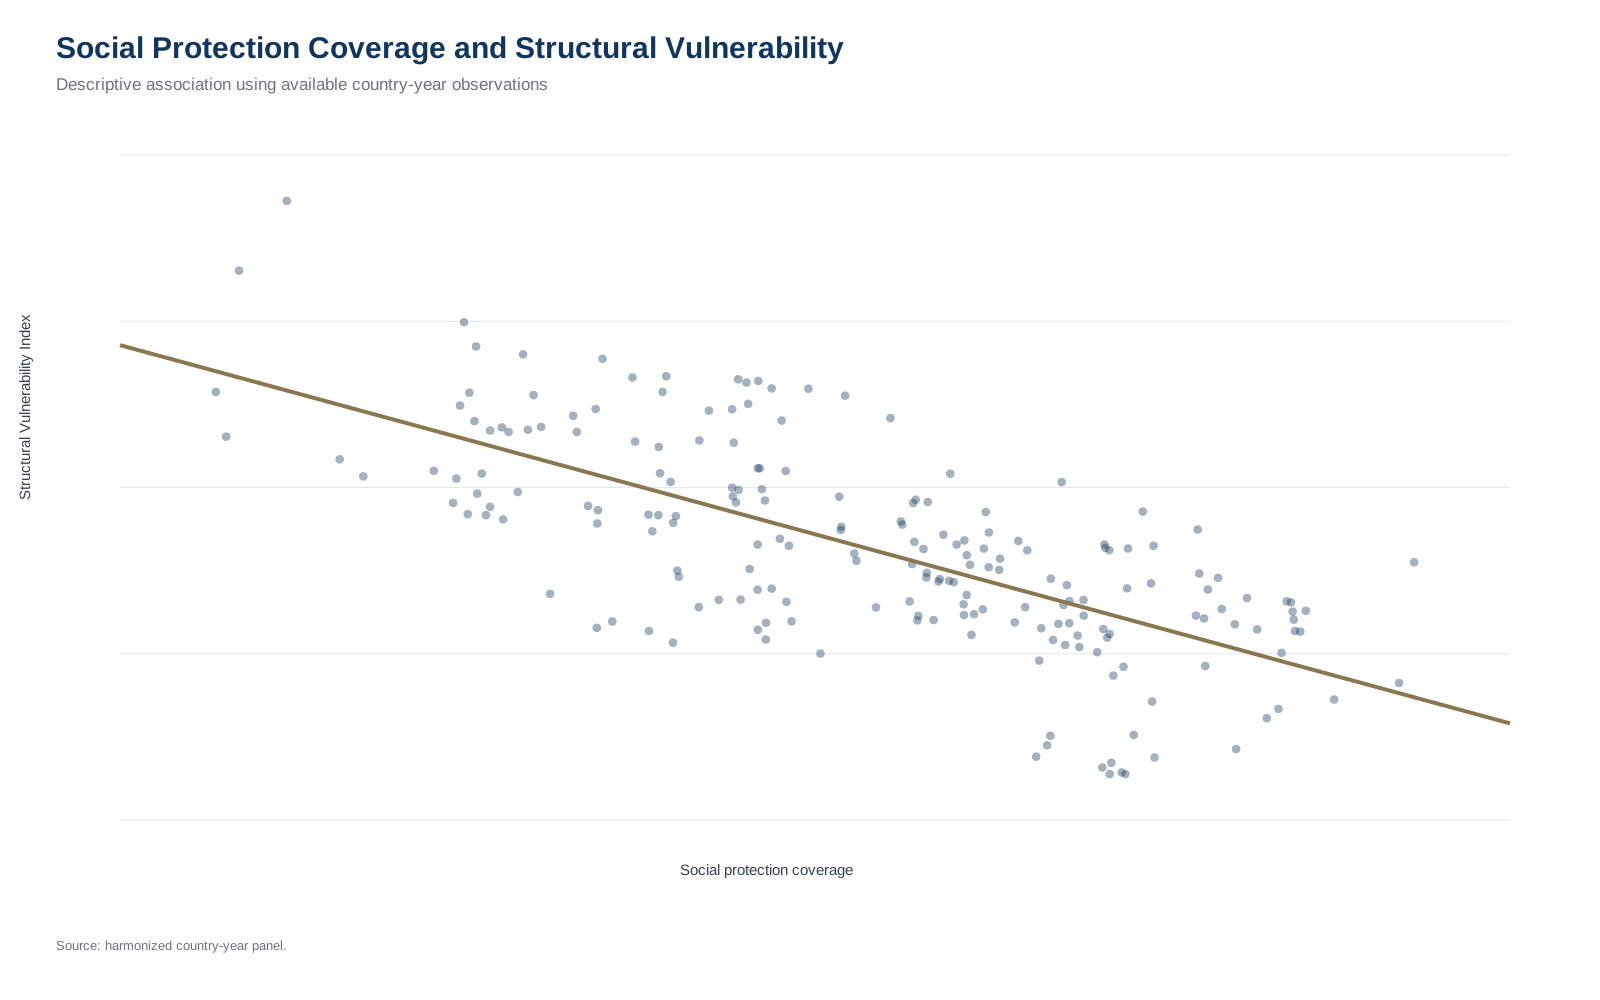
Social protection and vulnerability
Compares social protection coverage with vulnerability indicators.
Period: 2000-2023 panel. Unit: country-year indicators. Source: harmonized country-year panel and dashboard outputs. Note: channel separation is limited.
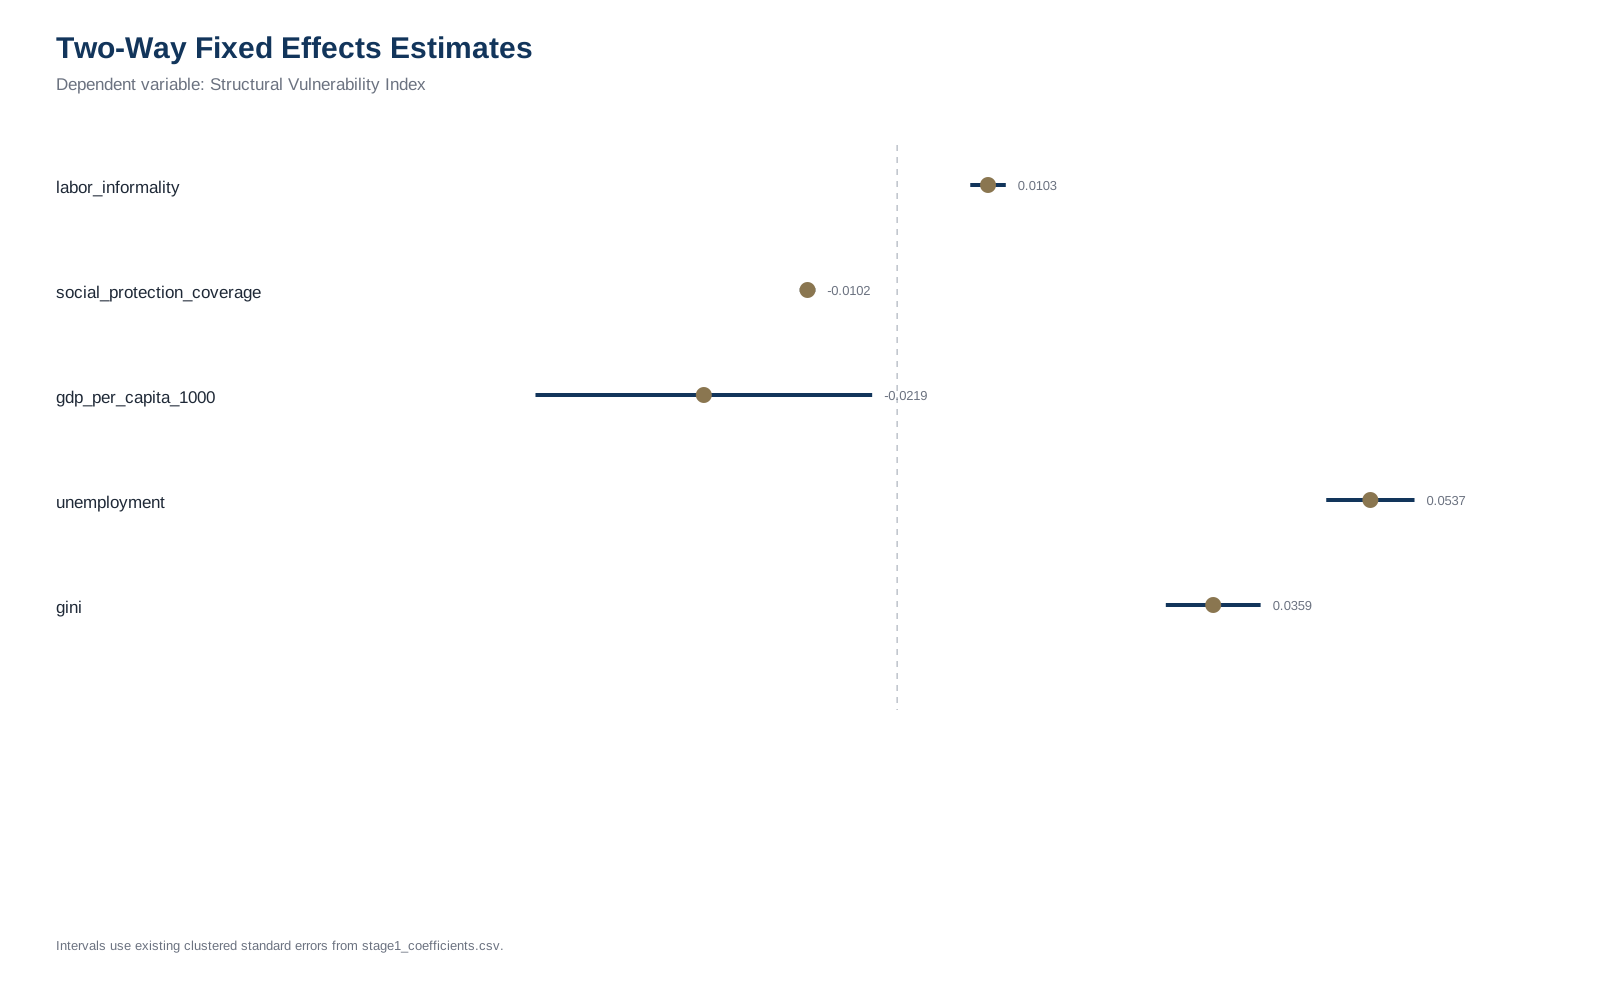
Model coefficients
Summarizes existing model association estimates.
Period: 2000-2023 panel. Unit: coefficients. Source: harmonized country-year panel and dashboard outputs. Note: model evidence is associational.
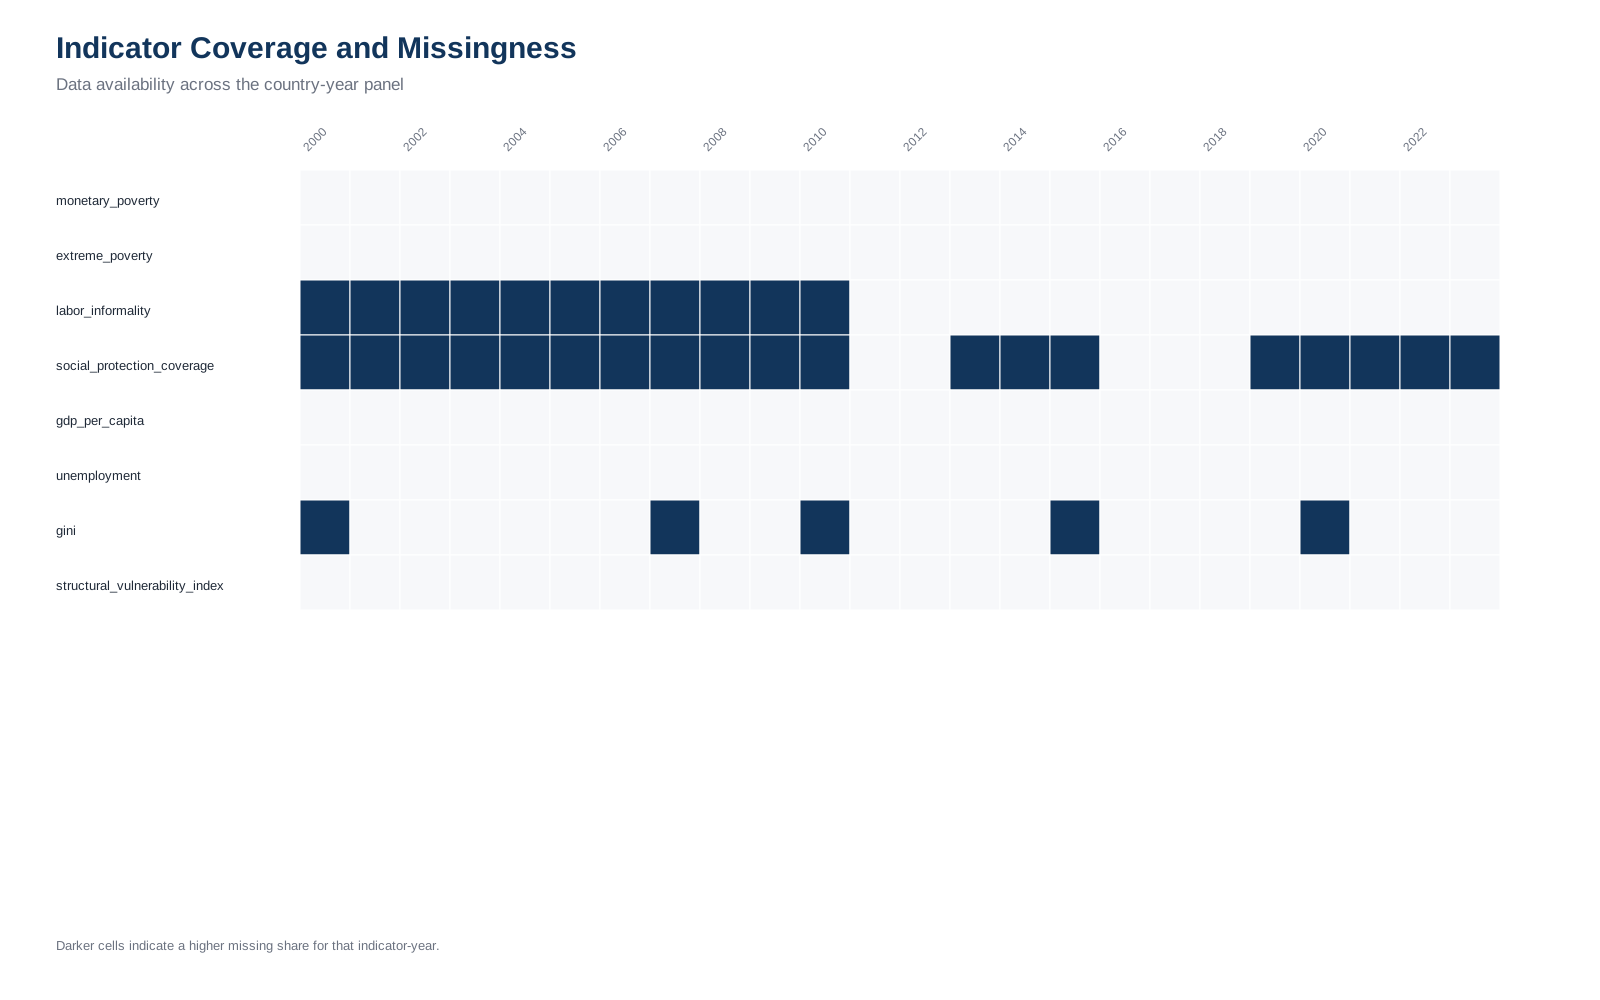
Missingness map
Documents data coverage limitations across indicators.
Period: 2000-2023 panel. Unit: missingness diagnostics. Source: harmonized country-year panel and dashboard outputs. Note: missingness affects comparability.
Executive Tables
Existing model and robustness tables.
Data and Workflow
From public indicators to dashboard products.
Data sources
Main variables include poverty, extreme poverty, labor informality, social protection coverage, GDP per capita, unemployment, inequality, gender labor indicators, social expenditure and the structural vulnerability index.
Analytical flow
- Public development indicators.
- Country-year harmonization.
- Missingness and data-quality checks.
- Structural vulnerability dimensions.
- Composite indicators and comparisons.
- Figures, tables, reports and dashboard.
Methodology
Existing methodological framework.
Data audit
Panel dimensions, country and year coverage, missingness, variable coverage, descriptive statistics and panel balance.
Index construction
Poverty, informality, social protection, GDP per capita, gender labor gap and unemployment components are used when available.
Normalization
Min-max normalization and z-score standardization are documented.
Weighting
The baseline index averages available normalized components.
Robustness
Sensitivity checks compare alternative weights and leave-one-component-out rankings.
Models
Panel outputs are descriptive or associational and preserve limits of interpretation.
Reproducibility
Documented commands and outputs.
Commands
powershell -NoProfile -ExecutionPolicy Bypass -File run_all.ps1
Rscript run_all.R
These commands were not executed during this website update.
Outputs
docs/: published site and documentation.outputs/eda/: exploratory figures and tables.outputs/models/: econometric outputs and tables.R/andscripts/: workflow scripts.
Limitations
Interpretation safeguards.
- The current panel is aggregate country-year data, not household microdata.
- Descriptive patterns should not be interpreted causally.
- Missingness differs across indicators, especially social protection and gender labor variables.
- Composite index rankings are sensitive to normalization, weighting and indicator coverage.
- If a variable is not present in the panel, scripts omit it or document it as unavailable in the current panel.
Citation
Cite this project.
Citation metadata are available in CITATION.cff.
Author
Monica Cueto Tapia
Applied Economist & Data Analyst.